
Appearance
Cohorts and shape models
A cohort is a set of vessels of the same kind (for example, the descending aortas of a group of patients, or their aortic arches with the supra-aortic branches). furca can encode them so that their feature vectors correspond component by component, align them, and build a statistical shape model: a mean shape plus principal modes of variation. Branched vessels are modelled whole, junctions included. The mathematics is in Cohorts: alignment and shape models.
Command line
sh
furca cohort data/*.vtp -o cohort/ --tau-size 24 --centerline-size 14On the synthetic cohort shown below (16 aortic arches whose bend angle, bend radius, vessel radius and tapering vary):
text
Cohort of 16 subjects
  feature vector     705
  alignment          rigid

Explained variance
  mode 1              57.3%  (cumulative  57.3%)
  mode 2              30.7%  (cumulative  87.9%)
  mode 3              10.5%  (cumulative  98.4%)
  mode 4               1.6%  (cumulative 100.0%)
Four modes explain all the variance, one per varying parameter.
The output directory contains:
| File | Content |
|---|---|
subjects/<name>.furca | Each subject, encoded with the shared structure and aligned. |
model.furca | The shape model. |
scores.csv | Coordinates of each subject along each mode, in standard deviations. |
alignment.json | The similarity applied to each subject and all parameters used. |
Options: --alignment none|rigid|similarity (similarity also removes size), --variance F (keep the modes explaining this fraction of the variance, default 0.99), the encoder flags of furca encode, and --params FILE with [encode], [alignment] and [model] sections:
toml
[encode.wall]
tau_size = 24
theta_size = 24

[alignment]
mode = "similarity"
tau_samples = 64       # landmark rings
theta_samples = 32     # landmarks per ring

[model]
variance_fraction = 0.95
Branched vessels
A cohort of branched vessels works the same way, when every subject has the same tree:
sh
furca cohort data/vmr/aortic-arch/*.vtp -o arches/text
Cohort of 6 subjects
  branches           4
  feature vector     3316
  alignment          rigid

Explained variance
  mode 1              46.0%  (cumulative  46.0%)
  mode 2              23.3%  (cumulative  69.3%)
  mode 3              15.7%  (cumulative  85.0%)
  mode 4               9.9%  (cumulative  94.8%)
  mode 5               5.2%  (cumulative 100.0%)
The aorta and its three supra-aortic branches: each subject is encoded as it would be alone, and the encoding fails, naming them, if some subjects have a different tree (for example a bovine arch, where two branches share a trunk, among normal ones). The model covers the whole vessel: the walls of every branch, where its junctions lie and how wide its branches are.
Loading…
The shape model of the six aortic arches of data/vmr/aortic-arch, branches included. Move a mode to deform the mean shape by up to one standard deviation of the cohort, about as far as its six subjects reach. Every shape is the mesh of the mean carried onto it, with the same faces.
Generating shapes
sh
furca model modes cohort/model.furca -o modes/ --count 3 --sd 2   # mean and ±2 SD per mode, same faces
furca model sample cohort/model.furca --scores 1.5,-0.5 -o shape.vtp
furca model sample cohort/model.furca --scores 1.5,-0.5 -o shape.furca
Loading…
The shape model of a synthetic cohort of 16 aortic arches whose bend, radius and tapering vary. Move a mode to deform the mean shape by that many standard deviations of the cohort, as furca model sample --scores does.
In the desktop application
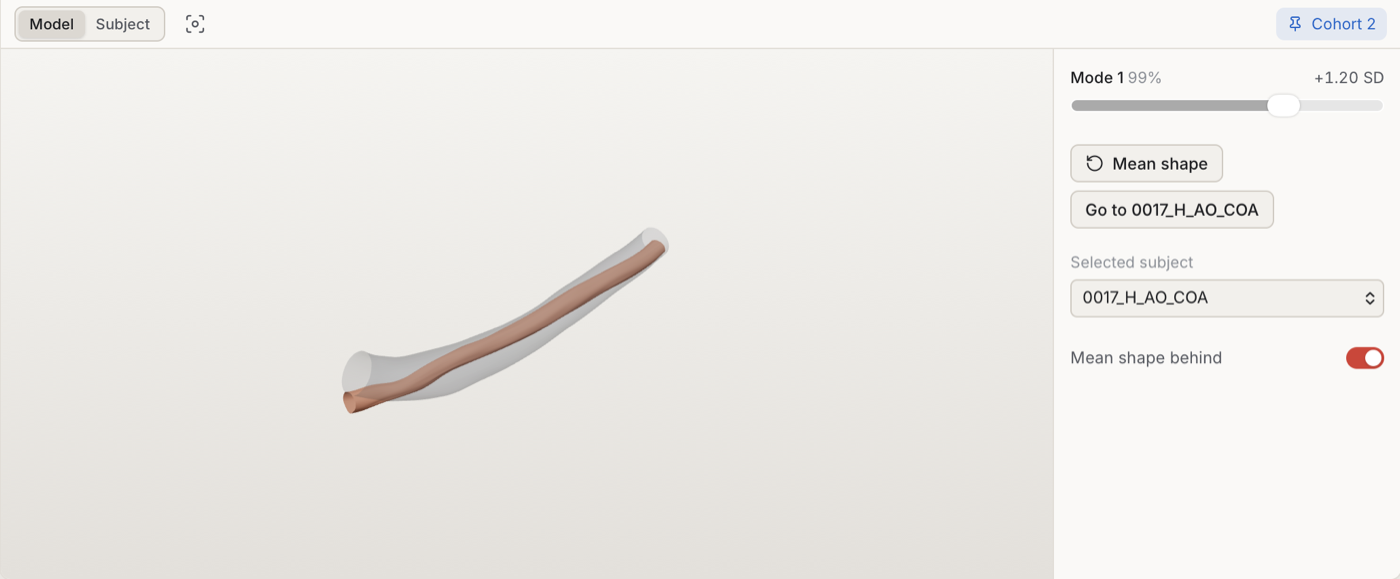
The shape model view: the shape at +1.2 standard deviations of the first mode, the mean shape faintly behind.
Open the surfaces of the subjects, then File › Create Cohort… (or the button under the documents). Choose the vessels, the alignment and the fraction of the variance the model keeps; the vessels are encoded again with a shared structure, using the default parameters of the settings. The cohort becomes a document of its own, with its views:
- Shape model: the shape with one slider per mode, in standard deviations of the cohort, with the mean shape faintly behind; or the selected subject, aligned with the cohort. Double-click a slider to return it to the mean.
- Scores: the subjects in two modes of your choice and the variance each mode explains. Click a subject to select it, double-click it to move the shape to it, and drag anywhere to move the shape along the two modes.
- Wall map, quantity Subject: how the selected subject differs from the mean shape, its wall radius minus the mean's at corresponding positions, relative to the mean radius.
In a cohort of branched vessels every shape is the triangulation of the mean carried onto it (Meshes with the same faces): while a slider moves, the shape follows it with the vertices placed by their coordinates alone, and when it stops, they are moved onto the exact wall; Computing the shape… shows while a shape is on its way. The wall map shows the branch chosen in the bar of the view.
The other views (3D, wall map, sections, profiles) show the mean shape of a cohort. The shape and the selected subject are shared by every view of the cohort, in every window. Save writes the shape model (the same .furca file as furca cohort), and the export panel writes the shape the sliders show, as a surface or an encoding. A model file opened later shows its subjects rebuilt from their scores (it keeps only the leading modes); a workspace keeps the subjects themselves.
Requirements on the data
- All subjects must be the same vessel segment, cut at corresponding anatomical places: τ = 0 and τ = 1 are the boundary centroids of every subject's inlet and outlets.
- Branched subjects must have the same tree: the same branches, joined the same way. With few subjects, shapes far from the scores of all of them (beyond about two standard deviations) are extrapolations, and the walls near the junctions, where the branches overlap, are the first to show it.
- The inlet rule (
inlet) must pick the anatomically corresponding end for everyone. - Sizes given as rules (the defaults) are resolved once, as the median over the cohort; give them explicitly to compare cohorts with each other.